
Continuous analysis
without operational bias risk.
Pre.sentient has developed the first rolling interim analysis solution blinded to all humans, eliminating operational bias risk. Continuous analysis inherently outperforms a single look, and the benefits to patients and sponsors are large and quantifiable.
We ensure a DMC, or other assessment entity, convenes at the optimal moment in a trial, with everything they need at their fingertips to make the best-informed decision. Your unblinded statistician's expertise is used as it is today, with greater respect for their time.
We are always looking to extend what our enclave infrastructure can do. If you have an analysis that would benefit from running in the blind, write to info@presentient.com.
Continuous analysis outperforms a single look
Fundamentally, a single look must be either early, when the evidence is weak, or late, when little time is left. A single look has to catch everything in one go, so with a matched error budget its threshold ends up sitting where ordinary noise trips the threshold frequently. A continuous rule does not have that problem.
For a matched sensitivity continuous monitoring substantially reduces false futility calls against a single look. Continuous monitoring also detects earlier than a fixed look the moment when futility becomes near-inescapable.
How the enclave interacts with current processes
The secure enclave
Pre.sentient's platform infrastructure is based on patent-pending computing architecture: a secure cloud accessing dedicated, isolated hardware enclaves where unblinded data is processed and cannot be accessed outside the enclave.
Inside the enclave sit the randomization codes, unified with continuously accumulating outcomes data, and Pre.sentient's prediction algorithm, which runs automatically on that now-unblinded data at frequent prespecified intervals.
No human can enter the enclave, and the data cannot leave it.
Improved DMC report quality
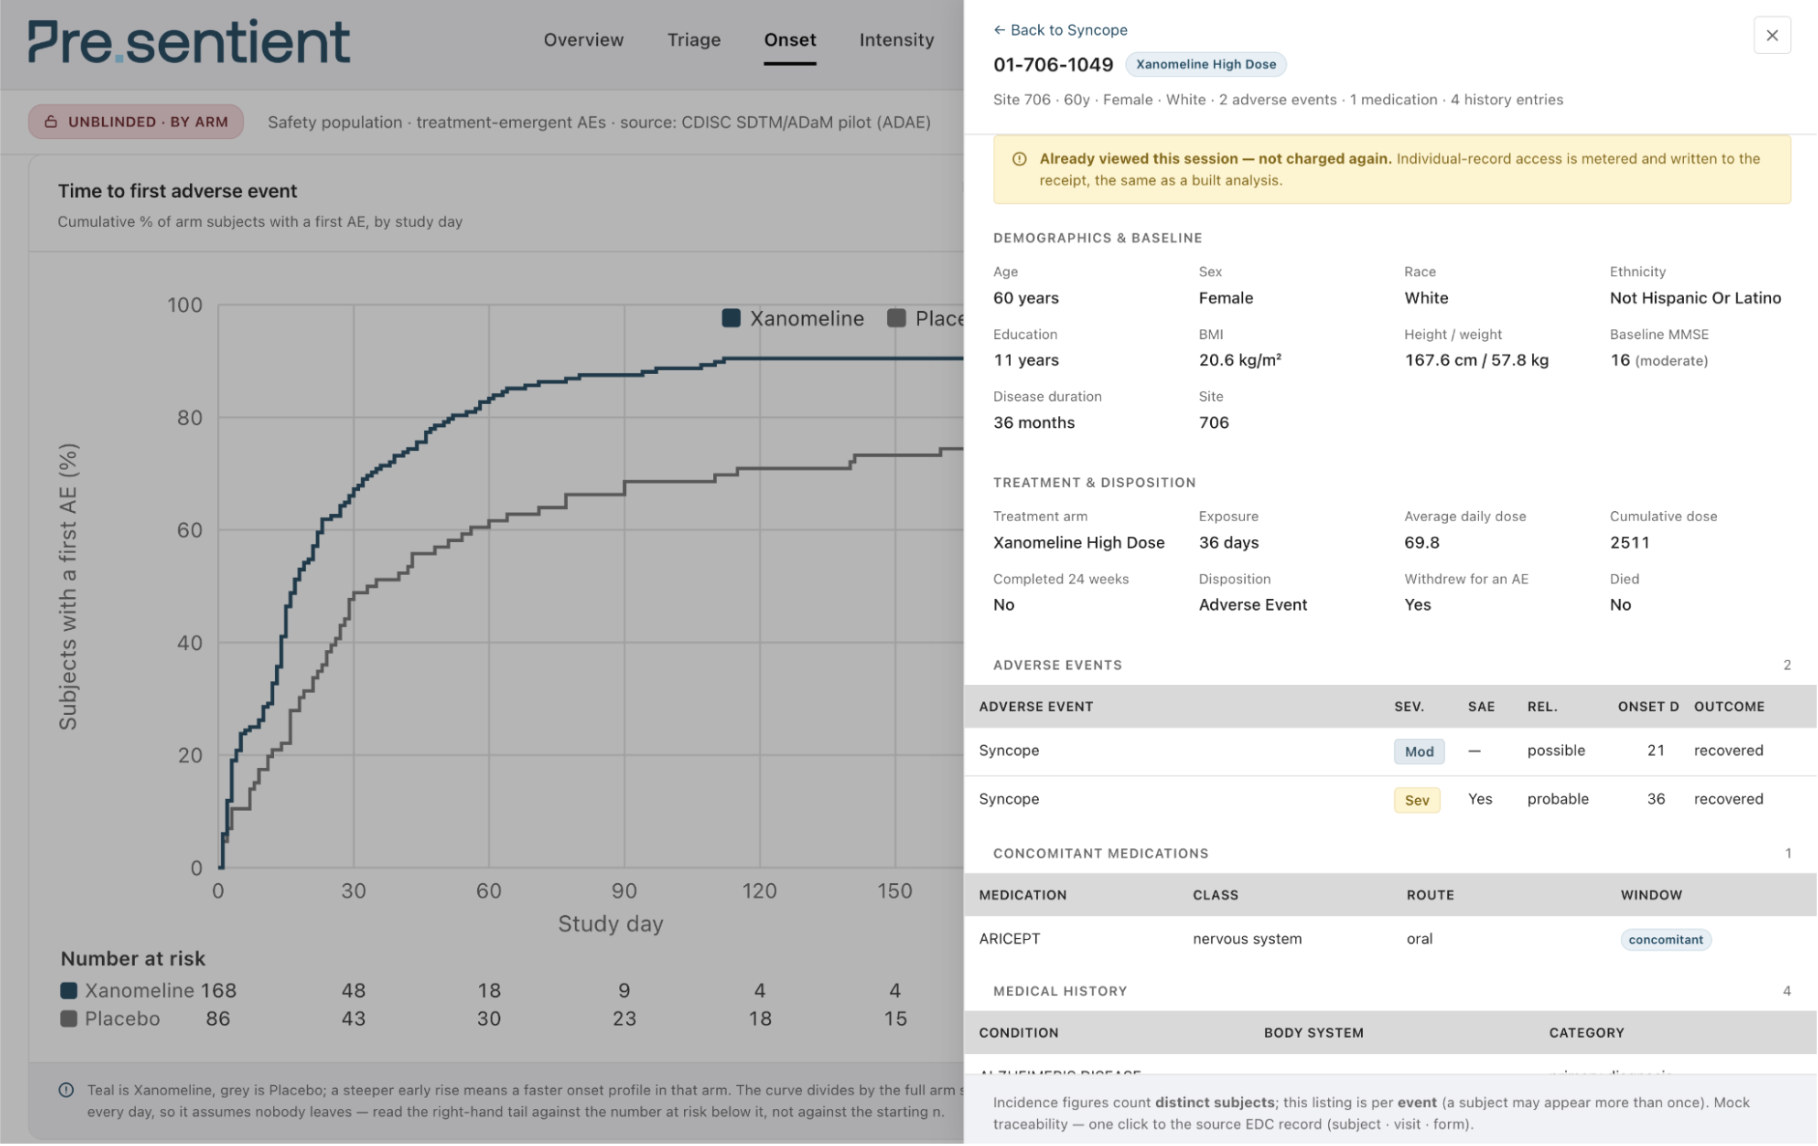
Augmenting the traditional 500 page static PDF report, our interactive dashboard will ensure the DMC can explore all the information they need at their fingertips to make key decisions during the meeting. This is explorable down to individual terms and patients and provides the best possible conditions for decision-making for closed, open and executive DMC sessions.
The simulation framework
Trigger thresholds are set by simulating tens of thousands of trials matched to the study design, then tuning the entire monitoring sequence to prespecified operating characteristics.
- Simulated against tens of thousands of trials matched to the study design
- The whole monitoring sequence tuned jointly, not look by look
- Error rates held under a budget agreed with the sponsor
- Locked and documented before first patient in
- Reproducible by the sponsor on the locked instance
The empirical dataset
The AACT dataset was downloaded from clinicaltrials.gov on 15 December 2025 and filtered for clean, complete Phase 2 trials with a single primary continuous outcome. The distribution of final p-values from this dataset was plotted, and a smooth kernel fitted to that distribution.
P-values were uniformly sampled from the distribution and converted to Cohen's d, a standardized effect size. For a sampled effect size E, and two study arms with equal participant numbers, outcome data were sampled from a normal distribution: the control arm defined with mean 0 and variance 1, the treatment arm sharing that variance and assigned a mean of E.
This addresses continuous endpoints in a Phase 2-like, two-arm synthetic trial dataset with 66 patients per arm, the mean arm size in the AACT dataset, powered to 80%. A total of 10,000 synthetic trials were generated with this method.
Emerging success, months before final analysis
A zero-alpha signal that lets Phase 3 preparation, regulatory groundwork and manufacturing scale-up begin early at reduced risk, while the trial itself runs to completion.
Pre.sentient's prediction algorithm is organized around a statistical principle: an interim statistic is compared with the corresponding point on a curve describing a hypothetical trial running perfectly along the boundary between success and failure. Success is defined as the final test statistic exceeding the critical value corresponding to the prespecified one-sided alpha of 2.5%.
The algorithm then estimates the probability that this distance can be covered with the remaining data. When the probability of eventual success exceeds the prespecified threshold, a success signal fires. Thresholds are set by simulation so the whole sequence of interim looks, jointly, stays within the agreed false-efficacy signal budget.
Because the likely-success signal does not initiate early stopping or any other trial adaptation, no alpha penalty is required for the final analysis. In current practice, open-label exploratory trials are routinely conducted with sponsors having continuous visibility of accumulating unblinded data, without that visibility requiring alpha adjustment at the final analysis. Similarly, exploratory double-blind trials might be unblinded before completion to initiate regulatory and sponsor development activities, without need for alpha spend.
This reasoning is aligned to that used in the ICH E17 guidance on multiregional clinical trials, where different regulatory regions may require different primary endpoints: since each regulatory region makes a decision solely on its designated endpoint, no multiplicity adjustment across regional endpoints is needed.
Similarly, in master protocols designed to evaluate multiple drugs with the same protocol and trial infrastructure, if regulatory decisions are based on comparisons of each drug to its control treatment, multiplicity adjustments across drugs are not needed.
Failing trials caught earlier, with a quarter of the false stops
Pre.sentient monitors continuously for emerging futility and recommends stopping if the evidence is overwhelming, catching failing trials months earlier than a scheduled interim.
The prediction algorithm mirrors the one used for success: an interim statistic is compared with the corresponding point on a curve describing a hypothetical trial running perfectly along the boundary between success and failure, and the algorithm estimates the probability that the distance can be covered with the remaining data.
When the probability of eventual failure exceeds the prespecified threshold, a futility signal fires. Thresholds are set by simulation so the whole sequence of looks, jointly, stays within the agreed false-futility signal budget.
On the 10,000-trial empirical benchmark dataset, 1.0% of trials that would have succeeded receive a stop recommendation across the entire monitoring sequence, not per look. 69.8% of failing trials are stopped early, at a mean of 50% information; 41% inside the first third, where stopping is worth most.
Aggregate safety data, unblinded by arm
To help sponsors satisfy the FDA's December 2025 safety reporting requirements, the enclave architecture enables continuous monitoring of aggregate safety data, unblinded by arm in a way that is blinded to all humans, to trigger assessment entity review.
- Sensitivity of per-arm unblinded analysis is 50% higher than conventional pooled blinded analysis
- Blinded-to-human per-arm monitoring of aggregated safety data, to trigger human review
- A live interactive dashboard, explorable down to individual terms and patients, in place of a 500-page PDF
Continuous evaluation of accruing safety data using multi-stage calibrated triggers for escalation to the assessment entity, the per-arm data determines when review by assessment entity is justified. This means safety signals can be reviewed in a timely fashion including between DMC meetings.
Key safety data is evaluated continuously as it accrues against a set of pre-specified thresholds. When a threshold is reached, it triggers a formal review of safety data by an assessment entity (DMC). This means that when a set of concerning events happens, it can be reviewed immediately instead of waiting for the next scheduled meeting.
There are multiple defensible approaches for what form the review trigger can take. In the case of pooled thresholds, we establish an expected event(s) rate, and compare it to the observed, once there is a significant increase in observed it justifies an expedited review. The expected rate is established in collaboration with the sponsor's clinical development team based on literature and previous trial results.
Alternatively, we use the enclave technology for monitoring unblinded safety data in the blind where no human can access it. This allows to directly monitor arm differences and not rely on comparing potentially noisy pooled estimates to thresholds built on even noisier prior information. For example, if the clinical development team is concerned about drug A's cardiac side effects, we can monitor the prevalence of MACEs in the treatment vs control arm, and once the difference is large enough, trigger a review.
Using both methods, we can continuously monitor metrics such as: total aggregate event rate, rate of an event-of-interest or a group of events-of-interest and more. The boundaries are calibrated to a preferable false-alarm rate and can be the stand-alone trigger for safety review, but recommended to act in addition with regular cadence reviews.
Whether a review is triggered by a boundary crossing or falls on the charter's regular cadence, the committee receives the same thing: an interactive safety reporting dashboard in place of the conventional static report. The dashboard instead gives reviewers a single signal-rich view they can move through at their own pace: aggregate rates at the top level, down through subgroups and events of interest, to the individual subject listings behind any signal that warrants a closer look.
Every analysis performed is captured in an audit trail, which can be submitted with the meeting minutes in the CSR as a complete record of what the committee saw and when.
A timely review of safety can not only allow to pause the trial for harm, preventing unnecessary patient exposure, but also help address key clinical issues in advance by aligning sites on prevention protocols, increasing monitoring frequency in high risk-factor patients, and implementing better toxicity management guidance. Such improvement in trial conduct results in higher patient satisfaction, fewer discontinuations and a reduced differential dropout, directly preserving efficacy and increasing probability of success.
In our paper, we quantify the gain of unblinded comparison: once the pooled threshold properly accounts for uncertainty in the expected rate the between-arm comparison averts close to twice as much harm at the same false-alarm rate, and unlike the pooled threshold it does not degrade when the assumed background rate turns out to be wrong.
Detect separation in strata, without breaking the blind
Probability of trial success can be improved by identifying underperforming subgroups and excluding them from future recruitment. Without breaking blinding, the platform monitors for this continuously, tracking the probability of success with the subgroup excluded against that of the whole trial as a time series across the accruing data.
As outcome data is accrued, both the probability of success of the trial and of the trial with the predefined subgroup of interest excluded is determined. Once the probability of success of the trial with the excluded subgroup is above that of the whole trial by more than the predefined threshold, a flag is raised. This flag indicates that future recruitment should exclude this underperforming subgroup because the trial is more likely to succeed without them.
The platform provides a time series of the probability of success of both the whole trial and the trial with the excluded subgroup at the points at which outcome data was accrued so that sponsors can see the difference in trajectories between the two. The platform also shows the distribution of outcomes in each arm, for the whole trial and with the subgroup of interest excluded, so the effect of the exclusion is visible directly.
Detecting underperformance of a prespecified subgroup while recruitment is ongoing allows eligibility criteria to be amended during the trial to improve the probability of success for the trial, rather than the finding emerging as a post-hoc subgroup analysis after the trial has completed, by which point the finding can only inform a subsequent study.
Sample size re-estimation
Underpowered trials corrected mid-flight, without spending alpha to adapt. A trial sized on the wrong variance or the wrong effect is underpowered from its first patient, and conventionally the only remedies are to over-design or to stop and restart.
A clinical trial sample size can be misjudged due to misspecification of either its variance or its effect size.
Variance — continuous. Variance misspecification is a sizing problem, best estimated with the within-arm estimator: no assumed effect, exactly independent of the treatment comparison, nothing borrowed that could itself be wrong. This requires randomization codes, which is why the field has settled for weaker blinded estimators or handed the job to a firewalled statistician. Pre.sentient runs it inside a trusted enclave, so the better estimator can monitor continuously, blinded-to-human, at no cost to alpha.
Effect size — a single look. Effect size needs the treatment contrast, so those looks stay rationed and pre-specified: one look, at an information fraction fixed before the trial opens, taking no stopping decision and producing only a sample size. How far that sample size moves is an optimization rather than a threshold — subjects are added until the marginal gain in conditional power falls below a price calibrated at design.
Alpha. The variance path reveals nothing about the effect. The effect path is protected at the final analysis by a combination test with weights fixed at design.
A trial that is mis-sized before its first patient, on either variance or an effect that came in wrong, is underpowered from the start. Detecting this during ongoing recruitment lets the sample size be corrected during the trial to restore its probability of success.
Interested in learning more about our statistical approach?
Schedule a conversation with our biostatisticians about your program, your challenges, and where Pre.sentient can add value.